FAO releases “World Review of Fisheries and Aquaculture for 2014”
June 27, 2014
By Matt Jones
 By 2012
The latest report from the Food and Agriculture Organization of the United Nations shows continued growth in the worldwide aquaculture sector while capture fisheries has flat lined.
The title is a misnomer, however, since with the exception of a few references to events in 2011 and 2013, the world data are those for 2012.
And there is a disclaimer that only those nations that collect and submit records are included: one large producer-nation, and several smaller and poorer nations make no attempt to monitor and/or disclose their fisheries and several European countries withhold some data because of confidentiality. Nevertheless, the report begins with the now familiar graph stretching back to 1950 when total fish production was only about 20 Million tones (Mt), almost entirely from capture fisheries.
Aquaculture begins to be significant at the global level in the late 1960s when total fisheries production was about 60 Mt, of which about 1Mt were farmed. From that point on aquaculture production grew progressively more rapidly than the capture fisheries, and by the late 1980s production was in excess of 10 Million tonnes per year. By this time the decline in the growth of capture fisheries was clearly apparent. Most wild stocks were either fully exploited or already being over-fished, and for the last 25 years or so, wild fisheries production has hovered around 90 Mt per year. In 2012, aquaculture production, both fresh water and marine, reached 66.6 Mt – an annual growth rate of 7.4% – for a total fish production of 158 Mt.
What do these numbers actually imply? Global fish production has grown at an average annual rate of 3.2% over the past 50 years, outpacing world population growth, which is about 1.6%. Overall per-capita apparent fish consumption (production/population) has increased from an average of 9.9 kg in the 1960s to an estimated 19.2 kg in 2012, driven by a combination of population growth, rising incomes and urbanization, and facilitated by the strong expansion of fish production and increasingly efficient processing and distribution channels. Per capita consumption has increased in developing regions (from 5.2 kg in 1961 to 17.8 kg in 2010) and even in low-income food-deficit countries (4.9 to 10.9 kg), indicating the increasing contribution that fish are making to the availability of protein world-wide.
Due to steady demand and declining domestic fishery production, a growing share of fish consumed in developed countries is imported. In developing countries, consumption tends to be based on locally – and seasonally available products, however, rising domestic income in those countries is less entirely dependent on species produced locally.
The increasing role of aquaculture
Total global aquaculture production in 2012 reached an all-time high of 90.4 Mt (live weight equivalent), worth an estimated US$144.4 billion. That included the 66.6 Mt of food fish noted above, and 23.8 Mt of aquatic algae, commodities often overlooked in the west, but extremely important in Asia. (Estimates for 2013 are 70.5 Mt and 26.1 Mt, respectively.) China alone produced 43.5 Mt of food fish and 13.5 Mt of aquatic algae in 2102. Some developed countries (e.g. USA) have reduced their aquaculture output (principally catfish) due to competition from countries with lower production costs.
World cultivated food-fish production has expanded from 32.4Mt in 2000, to 66.6 Mt. in 2012. Growth was relatively faster in Africa (11.7%) and Latin America and the Caribbean (10%). Production in Asia (excluding China) grew by 8.2% per year while annual growth rate in China, which produces more cultivated fish and seaweeds than any other nation, averaged 5.5%/year in 2000–2012.
Fifteen major producer countries accounted for 92.7% of all farmed food-fish production in 2012. Among them, Chile and Egypt became million-tonne producers in 2012, and Brazil has improved its global ranking significantly in recent years. However, Thailand’s production fell to 1.2 million tonnes in 2011 and 2012 owing to flood damage and shrimp disease. Japanese aquaculture recovered slightly in 2012 following the tsunami in 2011.
Farmed food fish production by top 15 producers and main groups of farmed species in 2012 (from FAO 2014)
What stands out here is the huge production of fresh water finfish in China and their (relatively) modest production of marine fish, which in turn contrasts with their huge volumes of crustacea and molluscs. Similar patterns prevail in other Asian countries, and in the USA. Norway shows a different pattern with almost all its productivity being in mariculture. There are other analyses of production by region (Africa, Asia, Oceania, Europe, Americas), and their relative historical growth, and value.
Of the 66.6 Mt of food fish grown two thirds (44.2 Mt) were finfish species, and of these, 38.6 Mt were freshwater species and 5.6 Mt (12.6%) were seawater species with an overall value of US$23.5 billion, representing 26.9% of the total value of all farmed finfish. Saltwater-grown finfish grown include a large proportion of carnivorous species, such as Atlantic salmon that command a higher price than most freshwater-farmed species.
Farmed crustaceans accounted for 9.7% (6.4 Mt) of food fish production by volume but 22.4% (US$30.9 billion) by value. Interestingly, from other sources comes the news that in 2014 the volume of farmed shrimp exceeded for the first time, that of the wild catch. Mollusc production (15.2 Mt) was more than double that of crustaceans, but with only half their value.
Species produced
The number of species registered in FAO statistics in 2012 was 567, including finfish (354 species, with 5 hybrids), molluscs (102), crustaceans (59), amphibians and reptiles (6), aquatic invertebrates (9), and marine and freshwater algae (37). They are grown in a variety of farming systems and facilities of varying technological sophistication, using freshwater, brackish water and ocean water.
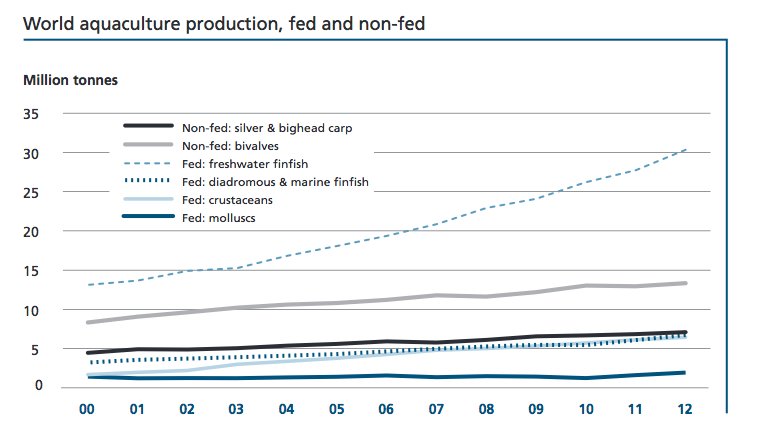
For most farmed aquatic species, efficient hatchery and nursery technology have been developed, but for a few species (e.g. eels, Anguilla spp.) farming still relies on wild seed. In 2012, global aquaculture production of non-fed species was 20.5 Mt, including 7.1 Mt of filter-feeding carps and 13.4 Mt of bivalves and other species. The share of non-fed species in total farmed food fish production declined further from 33.5% in 2010 to 30.8 percent in 2012, reflecting a relatively stronger growth in the farming of fed species.
The farming of tilapias and some other cichlids species, is the most widespread type of aquaculture in the world. FAO has recorded farmed tilapia production statistics for 135 countries and territories on all continents, and the number is likely growing.
According to the available data, in 2012, 33 countries and territories worldwide
harvested 23.8 Mt (wet weight) of aquatic plants from aquaculture, while capture production was 1.1 Mt. China and Indonesia accounted for 81.4% of farmed algae production. World production of farmed seaweeds more than doubled from 2000 to 2012.
Millions of Fish Farmers
Millions of people are employed directly in the aquaculture industry worldwide (not counting those in related dependent industries) and the range in productivity is equally noteworthy. It ranges from a low average of 3.2 tonnes per person (t/p) in China up to almost 66 t/p in North America.But there are clearly some discrepancies in the data, perhaps due to rounding.
There are also wide variations within the regions. For example: in 2011, the annual average production of fish farmers in Norway was 195 t/p, compared with 55t in Chile, 25t in Turkey, 10t in Malaysia, about 7t in China, about 4 t in Thailand, and only about 1t in India and Indonesia, which clearly represents the differing degrees of industrialization around the world.
Excluding notes and references, the FAO report extends to some 92 pages and covers a range of topics not discussed here. These include descriptions of conventional fisheries as well as aquaculture; the fate of the fish that are caught or grown; how much goes for food, how much for fish-meal and fish-oil (a declining percentage of the total); the principal nations that import or export fish and the amounts involved; and too many other subjects to review here. But an interesting factoid: fish and fish products are the single largest food commodities that are traded internationally, and the volumes are increasing. Also, on average, about a third of the animal protein consumed in the world is from fish, and the annual growth of per capita fish production (3.2%) is double that of population growth (1.2%).
– David Scarratt
Pull Quote
“The number of species registered in FAO statistics during 2012 was 567, including finfish (354 species), molluscs (102), crustaceans (59), amphibians and reptiles (6), aquatic invertebrates (9) and marine and freshwater algae (37).”